Climate change, particularly sea level rise, is an important factor leading to the deterioration of Maryland’s coastal marshes. The only way marshes can keep up with increasing water levels is by building up their elevation (through sediment accumulation on top of the marsh soil surface) and/or by migrating to uplands.
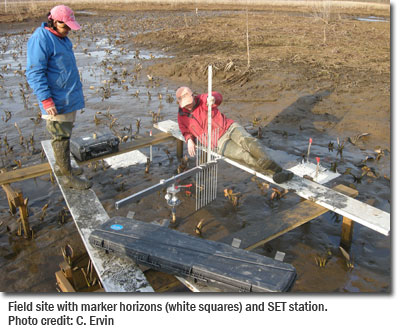
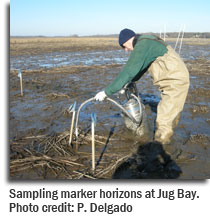
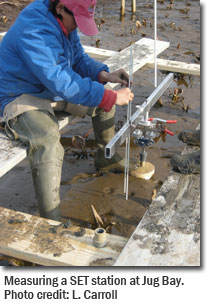 In an effort to better understand how the marshes in the Reserve will respond to sea level rise, CBNERR-MD started in 2007 a project to monitor marsh soil elevation change (as a result of erosion, marsh settlement, sediment accumulation) using two different field techniques: Surface Elevation Tables (SETs) and marker horizons. Both techniques are widely employed around the world as they allow scientists to determine if a marsh will be able to survive sea level rise trends. If a marsh surface elevation increases at a similar or greater rate that the increase in water levels, it is expected that the marsh will be able to survive, otherwise the marsh will start to become more flooded and fall apart.
At CBNERR-MD, monitoring of marsh surface elevation changes is currently conducted at Jug Bay and Monie Bay. Jug Bay has a total of 24 SETs that were established through two different studies. During the first study 12 SETs were established on the North and South Glebe marshes; measurements were taken from 1999-2001 and SETs were then re-measured in 2007 and 2008. In the second study, CBNERR-MD established 12 new SETs and marker horizons (3 per SET) in March of 2010 at three different Jug Bay marsh areas: Western Branch, Railroad Bed, and Mataponi Creek. In each of these areas, SETs were located in low and high marsh zones and were distributed along emergent vegetation transects that are also monitored by the Reserve. In Monie Bay, 12 SETs were established along Monie Creek in April of 2010. Similarly to Jug Bay, SETs were located in low and high marsh zones. All SETs sampled by CBNERR-MD are measured twice a year: in the spring (start of growing season) and fall (start of non-growing season).
 The primary objectives of this monitoring effort are to:
- Determine if in the long-term these marshes would be able to keep up with projected sea-level rise trends.
- Promote the use of this data to manage and protect CBNERR-MD vulnerable marshes.
- Promote the use of results from this project for education and stewardship purposes.
Marsh surface elevation data from Jug Bay show that the South Glebe marsh would be able to keep up with local sea level rise trends while the North Glebe marsh is not. This is partly a result of long-term hydrological restrictions caused by a railroad bed built in 1895 that separates both marshes.
Additional Information:
For more information regarding this project, to volunteer, or to request data, please contact please contact Stewardship Coordinator, Chris Snow (chris.snow@maryland.gov).
